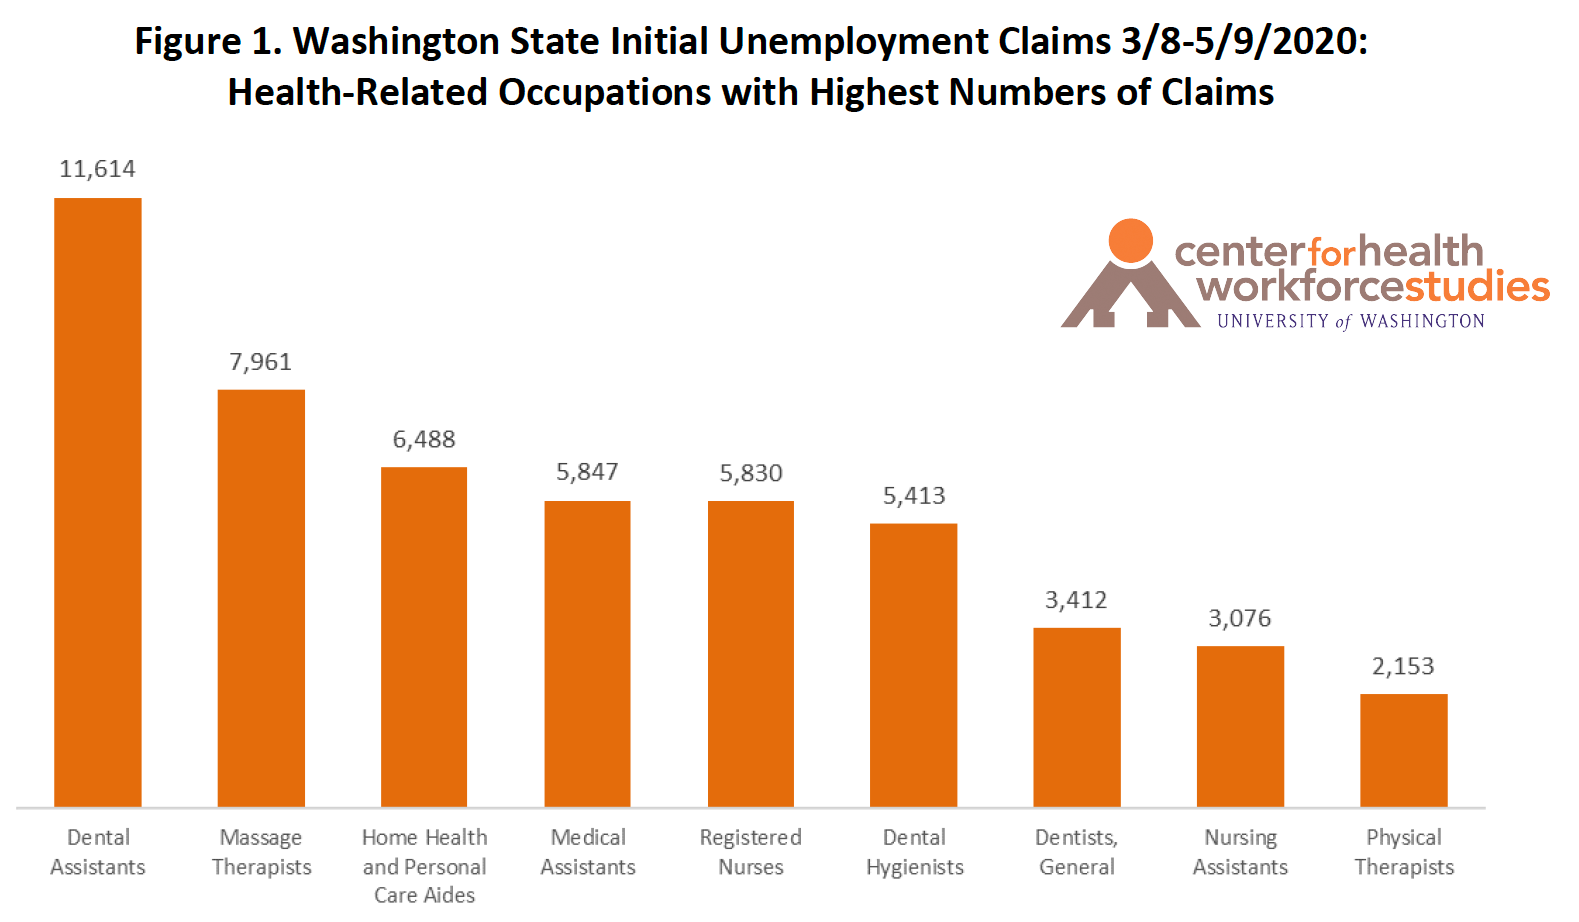
This summary shows initial unemployment insurance claims in Washington State for specific health care related
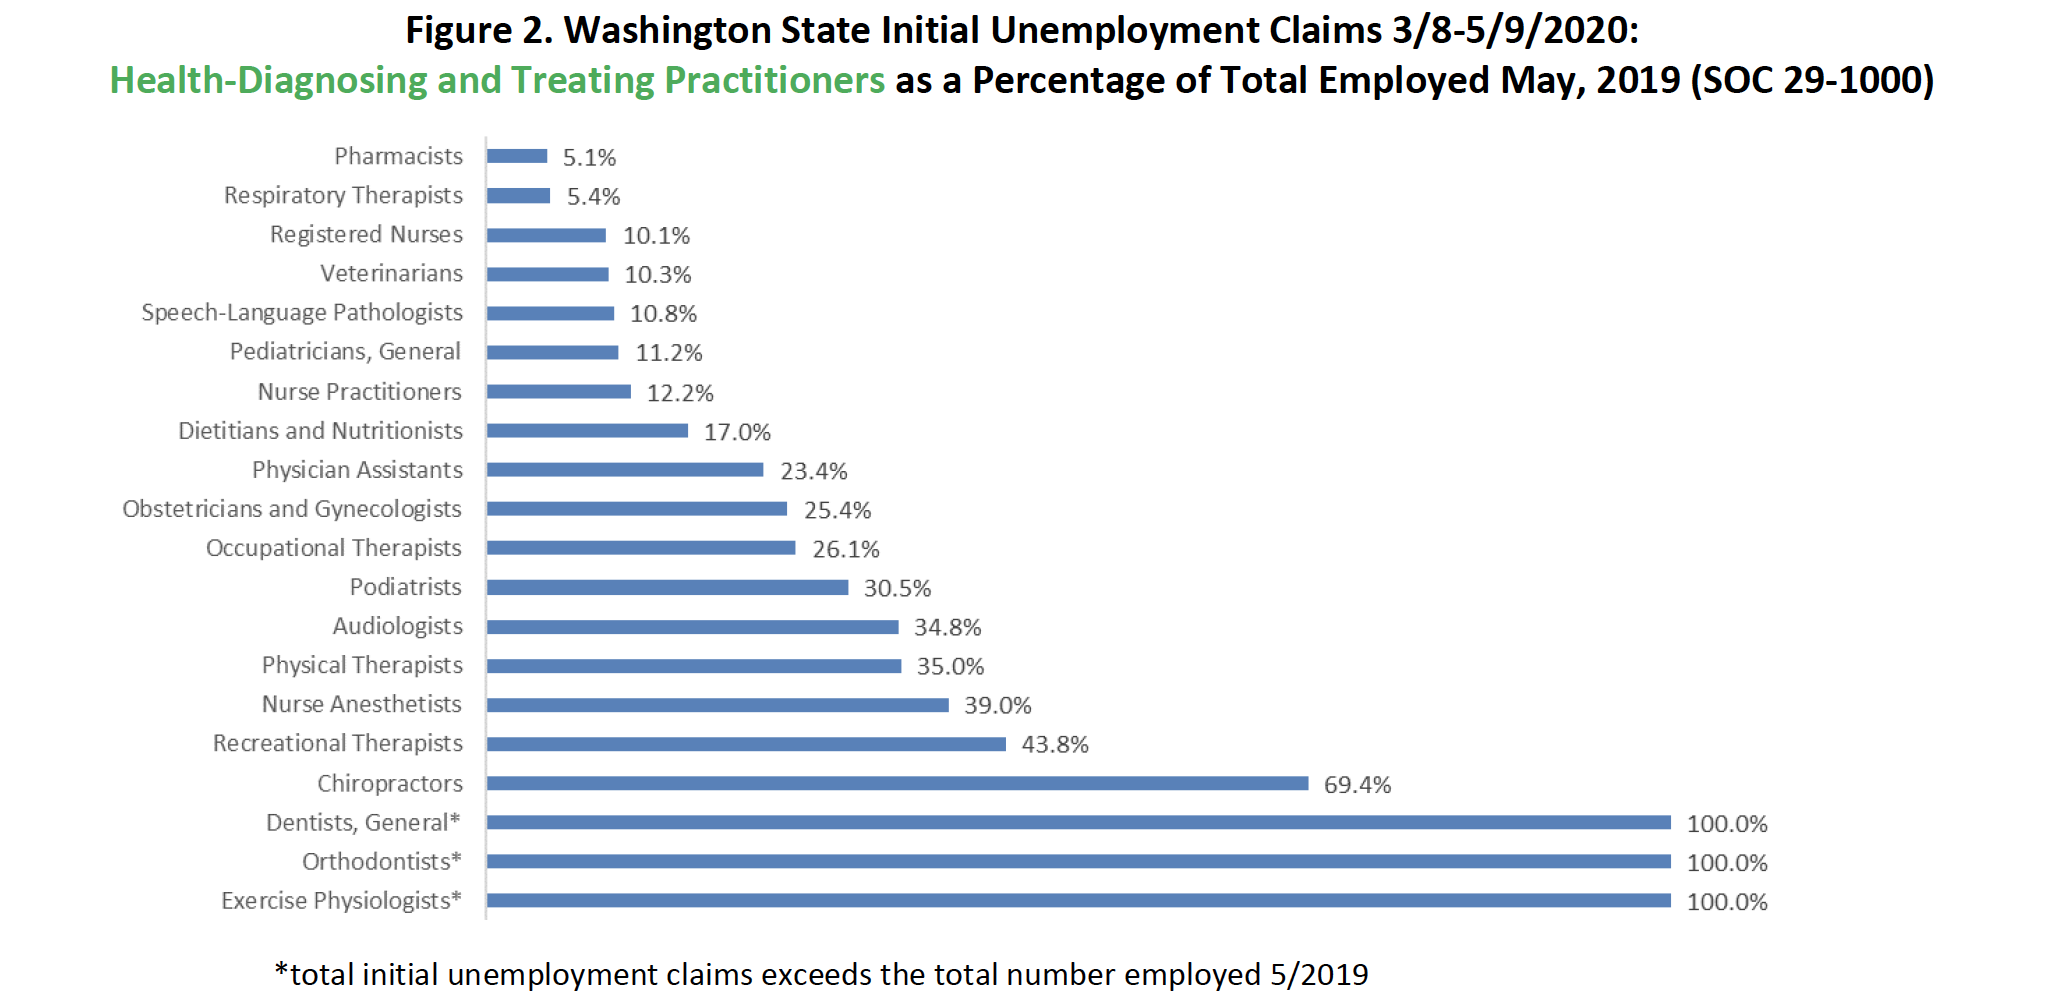
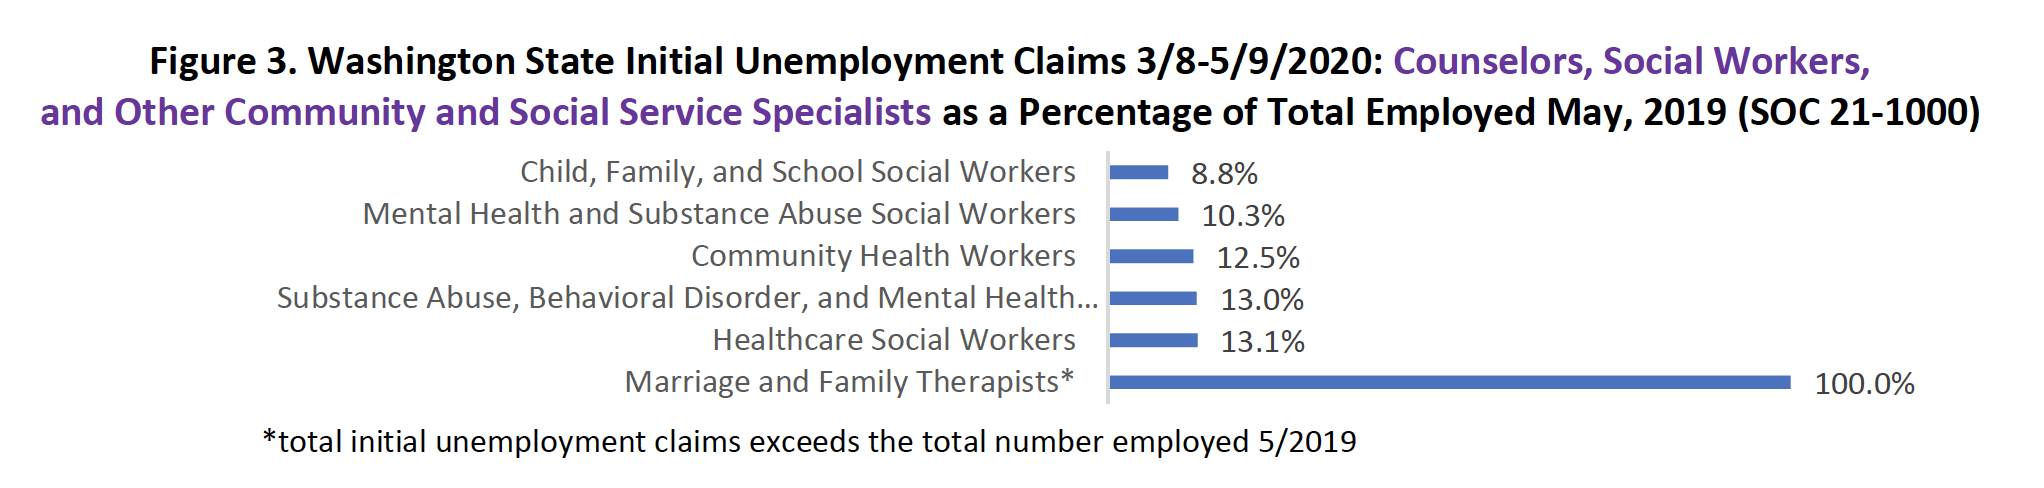
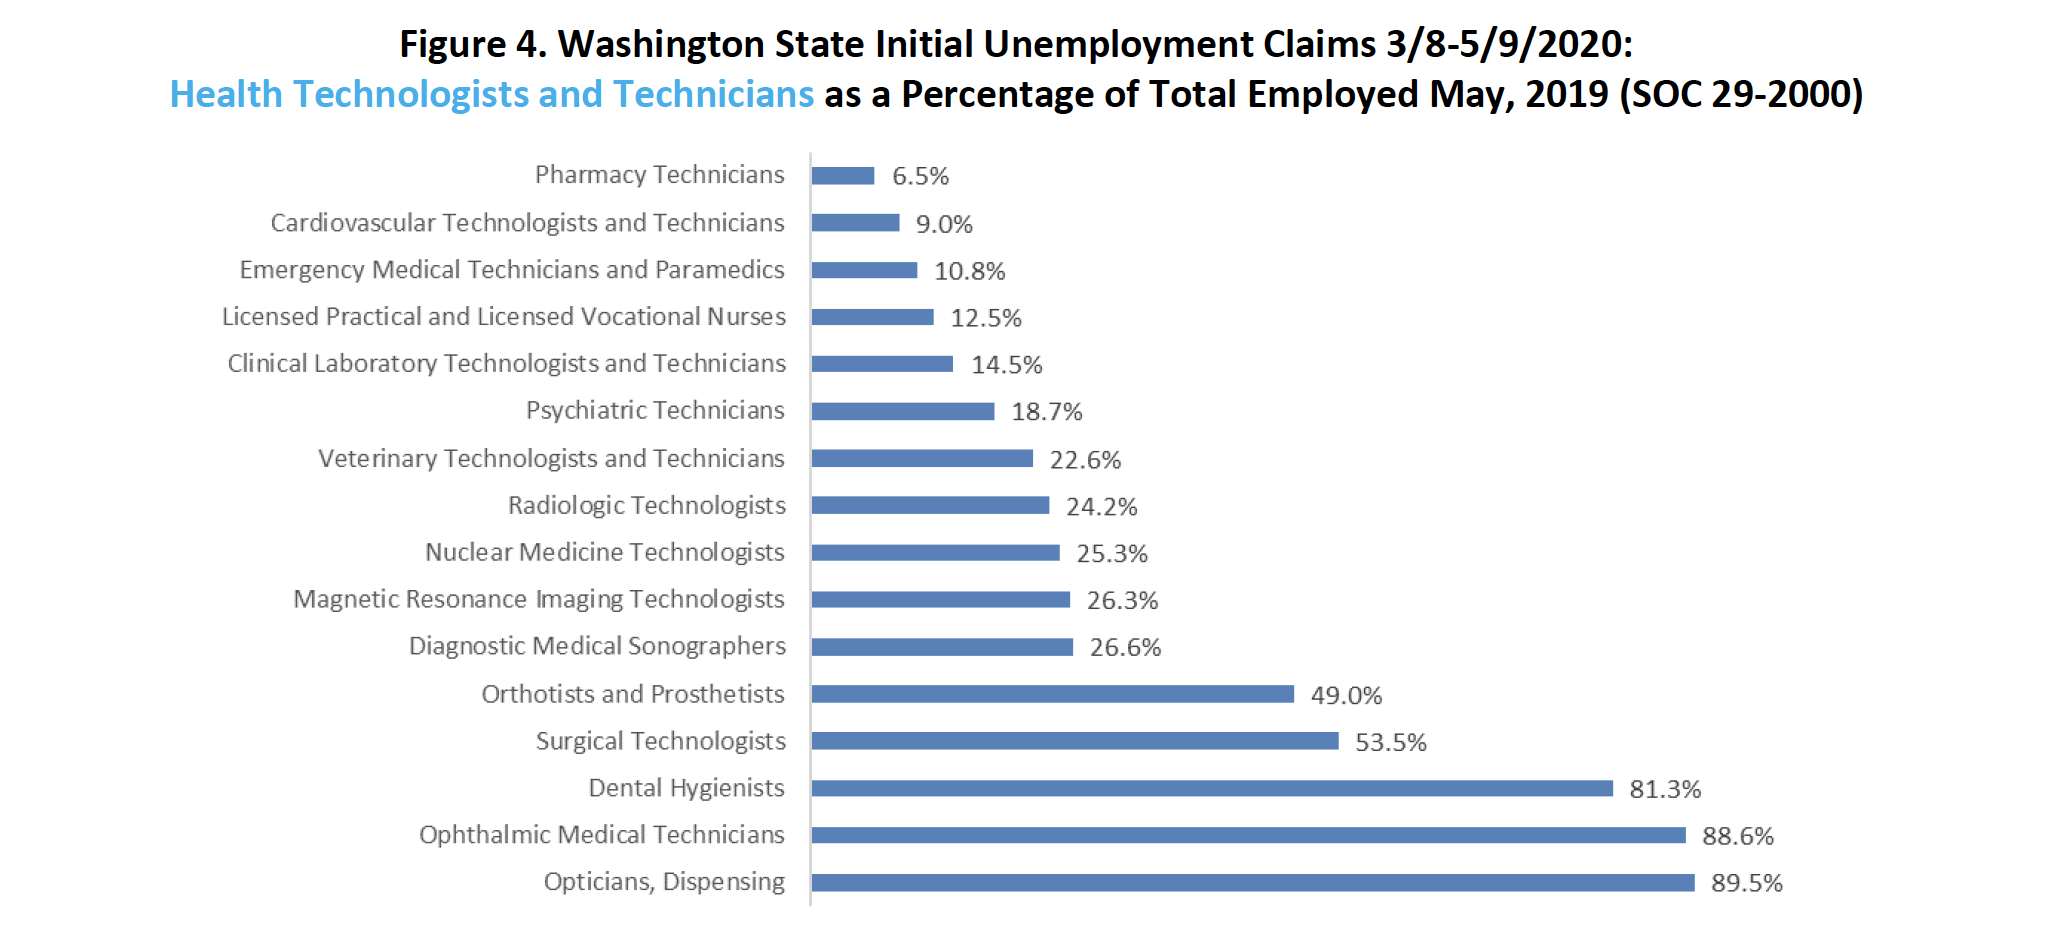
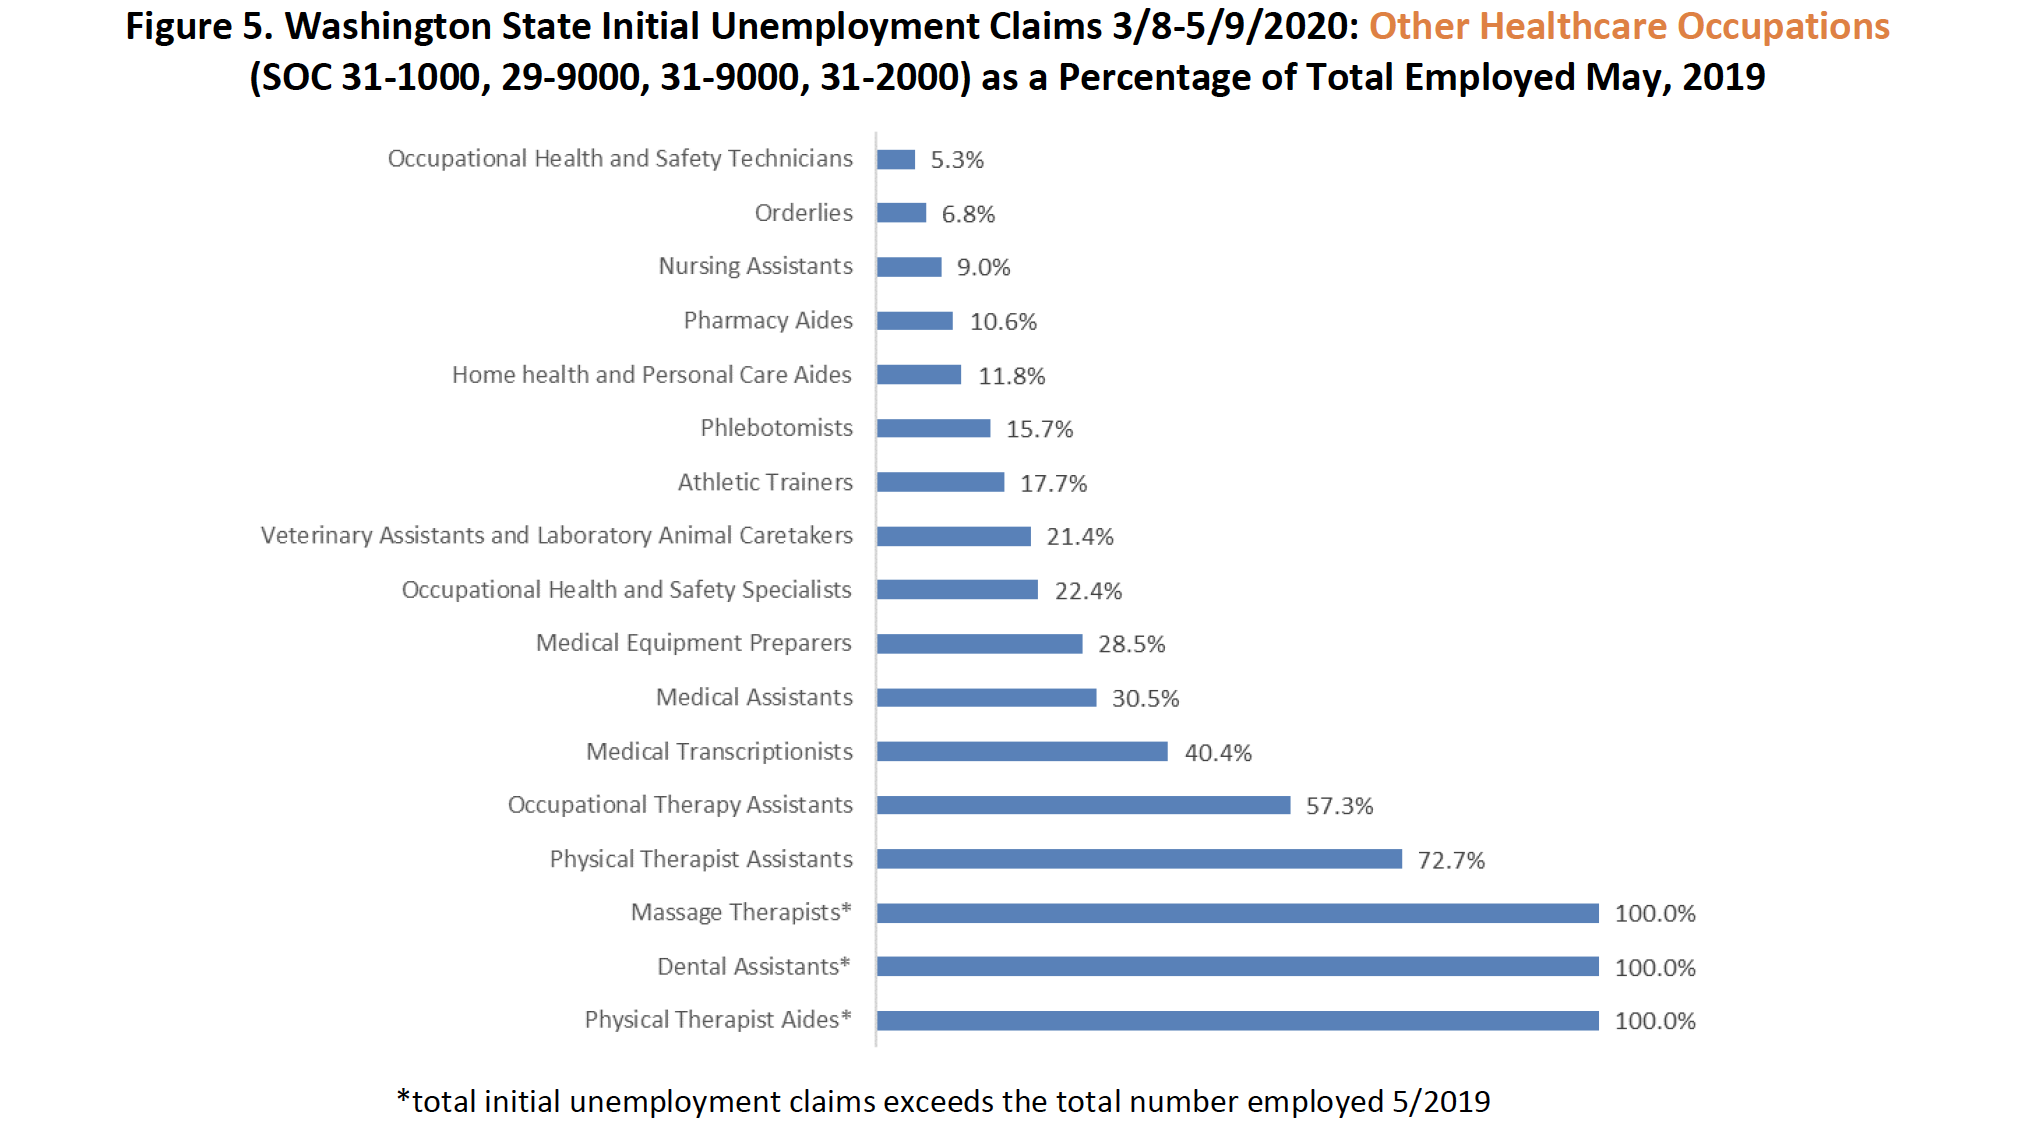
occupations from March 8 through May 9, 2020. Figure 1 shows the occupations with the largest total numbers of claims, and Figures 2 through 5 show initial unemployment claims for health care occupations with the highest
percentages, and/or for which data are available, as a percentage of total employment of each occupation in May 2019 (a year earlier). Data are from the Washington State Department of Employment Security (unemployment claims) and the U.S. Bureau of Labor Statistics’ Occupational Employment Survey (total employed in 2019 by occupation). Download PDF here
| SOC | Occupational Group | State Total through 4/4 |
State Total through 4/11
|
| 29-1011 | Chiropractors | 193 | 260 |
| 29-1021 | Dentists, General | 1,381 | 1,642 |
| 29-1023 | Orthodontists | 107 | 126 |
| 29-1031 | Dietitians and Nutritionists | 67 | 98 |
| 29-1051 | Pharmacists | 65 | 80 |
| 29-1071 | Physician Assistants | 261 | 354 |
| 29-1122 | Occupational Therapists | 370 | 432 |
| 29-1123 | Physical Therapists | 1,144 | 1,439 |
| 29-1127 | Speech-Language Pathologists | 159 | 188 |
| 29-1131 | Veterinarians | 73 | 102 |
| 29-1141 | Registered Nurses | 2,074 | 2,592 |
| 29-1151 | Nurse Anesthetists | 110 | 142 |
| 29-1171 | Nurse Practitioners | 198 | 245 |
| 29-1181 | Audiologists | 65 | 90 |
| 29-2011 | Medical and Clinical Laboratory Technologists | 230 | 314 |
| 29-2021 | Dental Hygienists | 4,786 | 5,006 |
| 29-2032 | Diagnostic Medical Sonographers | 129 | 196 |
| 29-2034 | Radiologic Technologists | 305 | 481 |
| 29-2035 | Magnetic Resonance Imaging Technologists | 73 | 113 |
| 29-2041 | Emergency Medical Technicians and Paramedics | 121 | 192 |
| 29-2052 | Pharmacy Technicians | 123 | 168 |
| 29-2053 | Psychiatric Technicians | 148 | 166 |
| 29-2055 | Surgical Technologists | 552 | 670 |
| 29-2056 | Veterinary Technologists and Technicians | 234 | 311 |
| 29-2057 | Ophthalmic Medical Technicians | 860 | 994 |
| 29-2061 | Licensed Practical and Licensed Vocational Nurses | 360 | 467 |
| 29-2081 | Opticians, Dispensing | 895 | 1,032 |
| 29-9091 | Athletic Trainers | 333 | 391 |
| 31-1011 | Home Health Aides | 1,515 | 2,017 |
| 31-1014 | Nursing Assistants | 944 | 1,271 |
| 31-2021 | Physical Therapist Assistants | 663 | 797 |
| 31-2022 | Physical Therapist Aides | 428 | 553 |
| 31-9011 | Massage Therapists | 3,828 | 4,487 |
| 31-9091 | Dental Assistants | 9,333 | 10,086 |
| 31-9092 | Medical Assistants | 2,646 | 3,461 |
| 31-9093 | Medical Equipment Preparers | 215 | 268 |
| 31-9094 | Medical Transcriptionists | 272 | 351 |
| 31-9095 | Pharmacy Aides | 61 | 84 |
| 31-9096 | Veterinary Assistants and Laboratory Animal Caretakers | 443 | 582 |
| 31-9097 | Phlebotomists | 172 | 265 |
| 31-9099 | Healthcare Support Workers, All Other | 660 | 814 |
SM Skillman/BK Frogner 6/15/2020 UW CHWS
Data Sources: Washington State Employment Security Department; US Bureau of Labor Statistics Occupational Employment Survey
Download PDF here