Supply Estimates

Estimated Number of Health Care Workers per 100,000 Population in Each State, by Occupation and Data Source

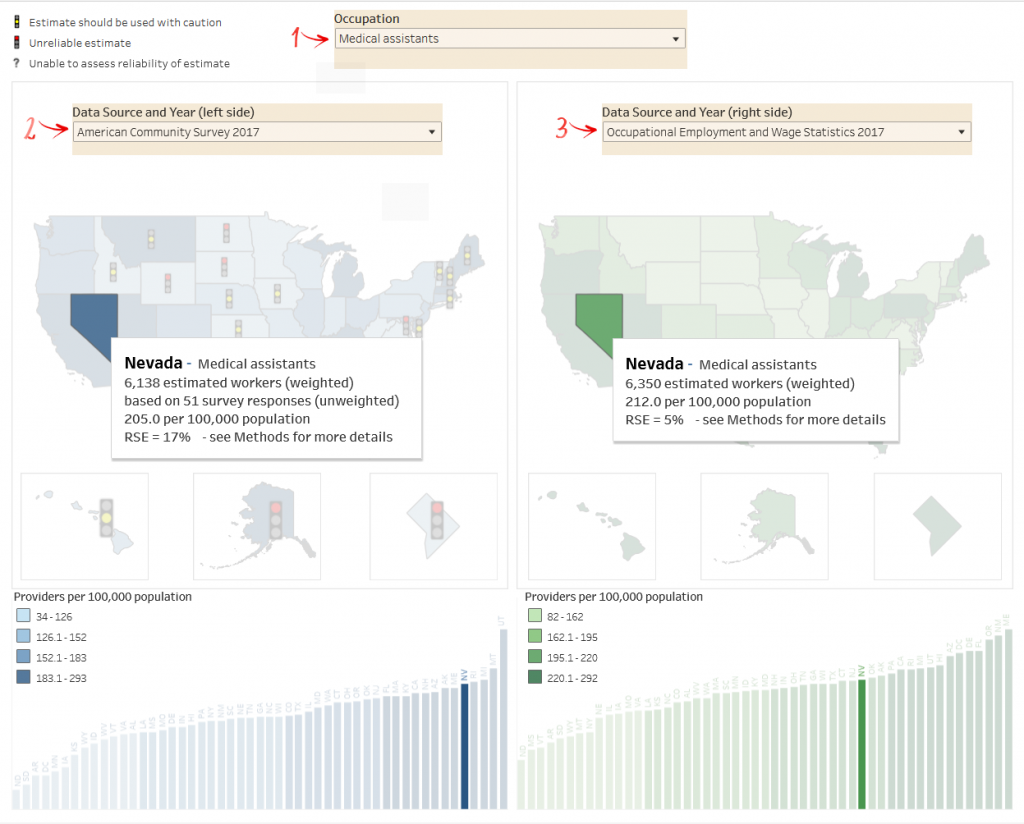
The charts below show the estimated number of health care workers per100,000 population in each state based on responses to the American Community Survey and Occupational Employment and Wage Statistics using one-year files for 2011, 2014, 2017 and 2020 for each data source. To provide context, we also included 2019 and 2021 data for comparison. See the FAQ  and the “Comparing 2019, 2020 and 2021 data” tab for more details.

The chart below shows the variation in national estimates for the number of workers in each occupation category using American Community Survey 1-year files for 2019, 2020 and 2021. Click on an occupation to see state-specific estimates. Hover over a year to see additional information. See the FAQ questions about accuracy and reliability for more details.

This dashboard was designed to serve as a supplement to a report outlining methodological and analytical considerations when using different public data sources to understand supply estimates of the allied health workforce (Dahal A, Stubbs BA, Frogner BK, Skillman SM. Leveraging Data to Monitor the Allied Health Workforce: State Supply Estimates. Center for Health Workforce Studies, University of Washington, November 2021). One of the conclusions from that report stated:

Multiple data sources are needed to generate state-level estimates of the supply of allied health workers, including size and distribution of the workforce. Public data play a critical role in the ability of health workforce researchers and health workforce planners to make these estimates.

In addition to adding an extra year of data that was not included in the report, this dashboard is meant to allow easy comparison of supply estimates from different data sources.

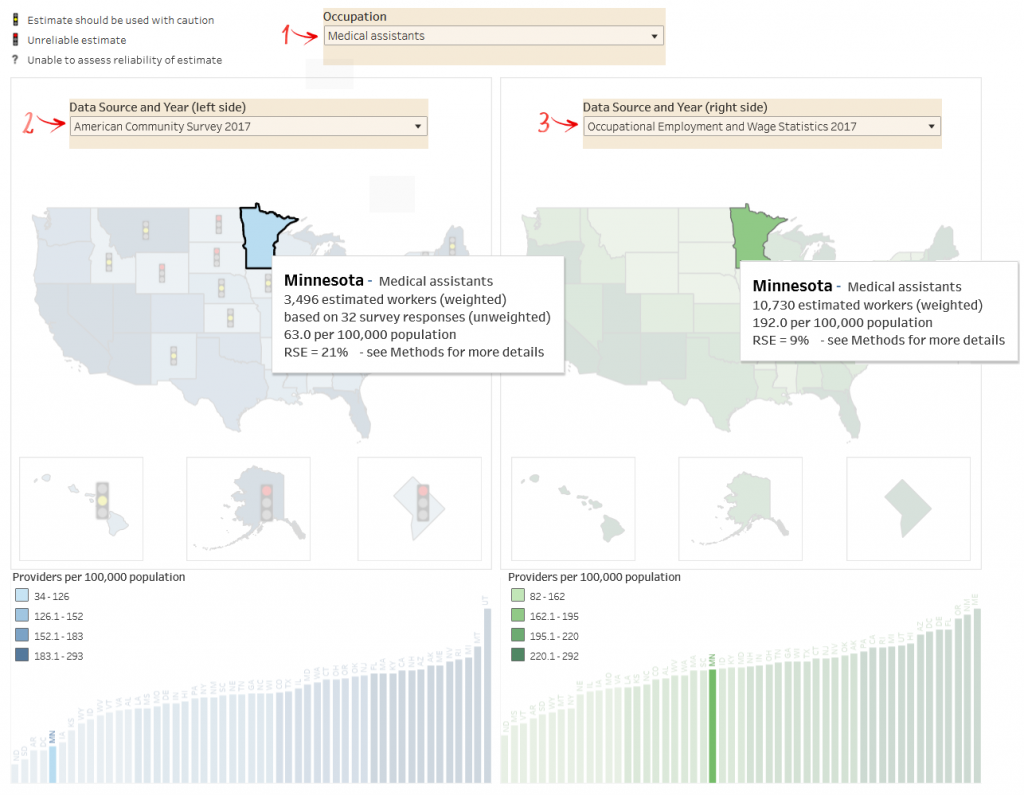
Example 1: Comparing different data sources for the same year

Comparing the estimated supply of Medical Assistants in Nevada in 2017, the estimates from the ACS and the OEWS are similar: 6,138 medical assistants (205 per 100,000 population, RSE = 17%) based on ACS and 6,350 medical assistants (212 per 100,000 populations, RSE = 5%) based on OEWS.


Comparing the estimated supply of Medical Assistants in Minnesota in 2017, the estimates from the ACS and the OEWS are not consistent: 3,496 medical assistants (63 per 100,000 population, RSE = 21%) based on ACS and 10,730 medical assistants (192 per 100,000 populations, RSE = 9%) based on OEWS.

Example 2: Comparing different years for the same dataset

Comparing the estimated supply of Medical Assistants in Minnesota in 2011 and 2014 based on the ACS: 5,173 medical assistants (97 per 100,000 population, RSE = 19%) in 2011 and 6,701 medical assistants (123 per 100,000 populations, RSE = 18%) in 2014.

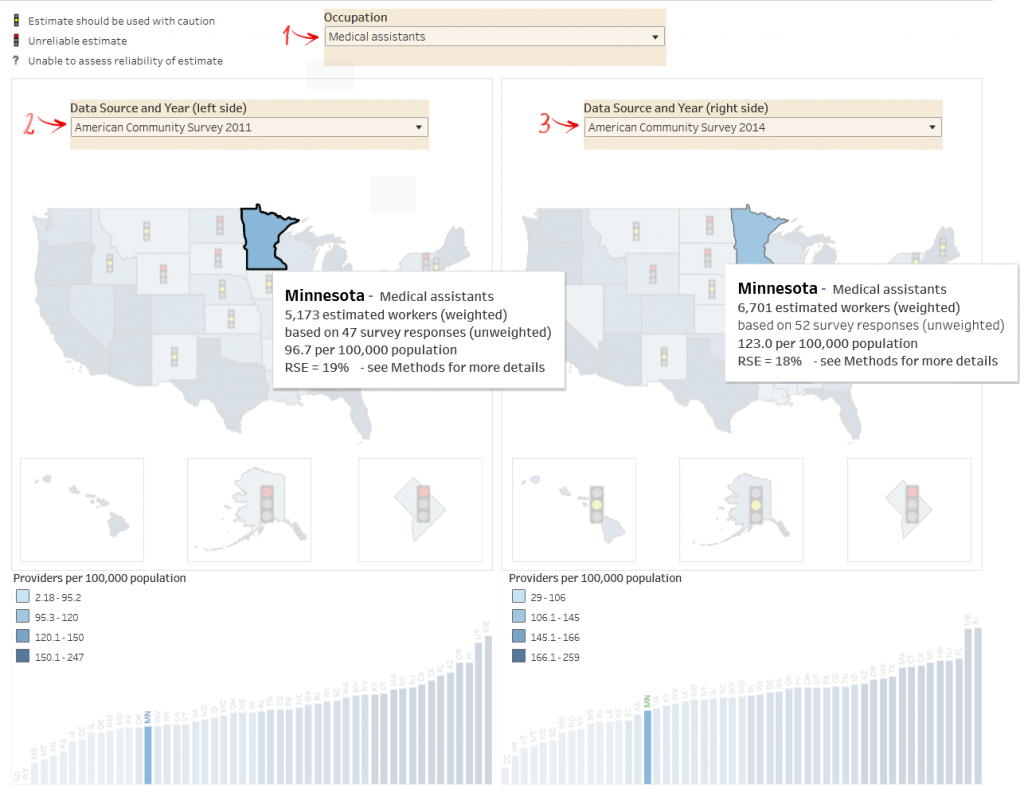
The examples above suggest a growth trend in the number of Medical Assistants in Minnesota since 2011. The lower estimated number of Medical Assistants per 100,000 population in Minnesota in 2017 (as shown in Example 1) may not be a reliable estimate, unless there are plausible reasons for expecting the numbers to decrease in 2017 compared with 2011 and 2014 (as shown in Example 2).

As the published report and the FAQ indicate, one way to assess the reliability of these supply estimates is to consider the relative standard error (RSE) of each estimate. Based on published recommendations, estimates with a RSE of 25% to 49.9% should be interpreted with some caution, and the estimates with a RSE of 50% or greater should be regarded as unreliable. The stoplights provide a visual signal of these recommendations, with a yellow light indicating the estimate should be treated with caution and a red light indicating that the estimate is unreliable.

Example 3: Special considerations when using ACS 2020 data

Image for example 3: In this example we see that the estimated number of MAs in Minnesota has a smaller sampling error in 2020 (RSE = 5%) compared to the larger sampling error in 2021 (RSE = 23%). Due to low response rates in 2020, ACS used experimental weights that result in smaller RSEs than in other years. Also note that the United States map for ACS 2020 data has fewer stoplights than the 2021 map, showing the overall lowering of sampling error due to how the Census Bureau applied weights in ACS 2020 data to adjust for low response rates. This difference is due to changes in the statistical methods used rather than a true difference in the uncertainty of the estimates.

In this example we see that the estimated number of MAs in Minnesota has a smaller sampling error in 2020 (RSE = 5%) compared to the larger sampling error in 2021 (RSE = 23%). Due to low response rates in 2020, ACS used experimental weights that result in smaller RSEs than in other years. To learn more, read here. Also note that the United States map for ACS 2020 data has fewer stoplights than the 2021 map, showing the overall lowering of sampling error due to how the Census Bureau applied weights in ACS 2020 data to adjust for low response rates. This difference is due to changes in the statistical methods used rather than a true difference in the uncertainty of the estimates.

Suggested citation:

Stubbs BA, Dahal A, Frogner BK, Skillman SM. Supply Estimates. UW Center for Health Workforce Studies. First posted October, 2022. Updated March 18, 2025. [Accessed date]. https://familymedicine.uw.edu/chws/resources/leveraging-data/supply-estimates/